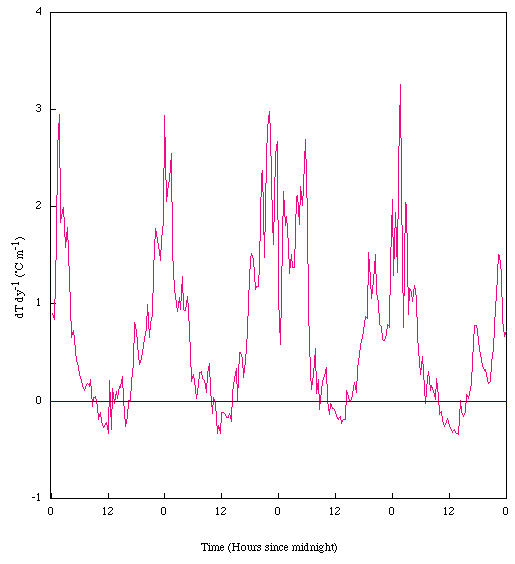
Figure 7. Temperature gradient between the arms of the BREB system. Positive values indicate greater temperatures at the upper arm than at the lower arm.
Title Page
Abstract
Introduction
Figure 1. Energy balance components under advective conditions
Figure 2. Bowen Ratio Energy Balance Tower
Figure 3. False Color Infrared Image of the Virgin River Floodplain
Figure 4. Schematic Representation of Advective Energy Balance and Wind Profile Conditions
Figure 5. Polar Representation of Horizontal Wind Profile
A Physical Model of Sensible Heat Transfer
Figure 6. Wind Speed Tangential to the Floodplain (Wind Speed * | sin (wind direction) |)
Figure 8. Sensible Heat Advection into the Floodplain (q'' from above)
Conclusions
References and Further Reading