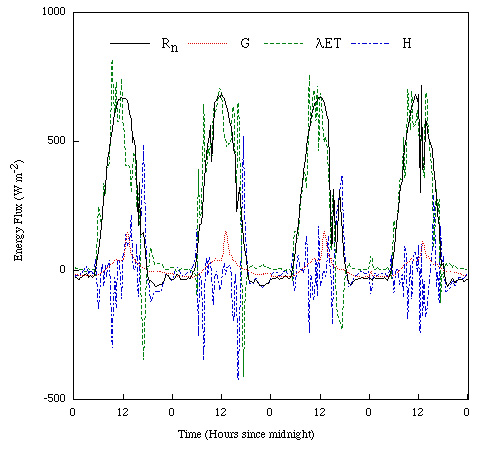
Figure 1. Energy balance components measured using a Bowen Ratio Energy Balance (BREB) system over the floodplain. Continuous measurements are presented from June 27, 1994, through June 30, 1994.
Title Page
Abstract
Introduction
Figure 2. Bowen Ratio Energy Balance Tower
Figure 3. False Color Infrared Image of the Virgin River Floodplain
Figure 4. Schematic Representation of Advective Energy Balance and Wind Profile Conditions
Figure 5. Polar Representation of Horizontal Wind Profile
A Physical Model of Sensible Heat Transfer
Figure 6. Wind Speed Tangential to the Floodplain (Wind Speed * | sin (wind direction) |)
Figure 7. Temperature Gradient Across the Upper Turbulent Boundary Layer (dT/dy)
Figure 8. Sensible Heat Advection into the Floodplain (q'' from above)
Conclusions
References and Further Reading