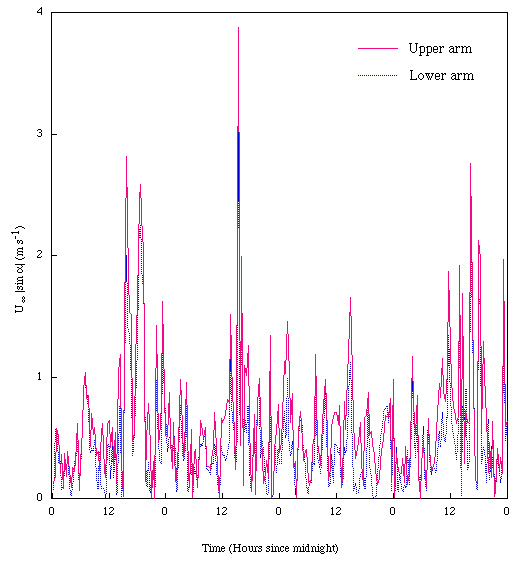
Figure 6. Sine-weighted wind speed measurements during the time interval of Figure 1. The sine function weighs in favor of heat transfer traversing the floodplain (as in Fig. 4) over heat transfer along the corridor.
Title Page
Abstract
Introduction
Figure 1. Energy balance components under advective conditions
Figure 2. Bowen Ratio Energy Balance Tower
Figure 3. False Color Infrared Image of the Virgin River Floodplain
Figure 4. Schematic Representation of Advective Energy Balance and Wind Profile Conditions
Figure 5. Polar Representation of Horizontal Wind Profile
A Physical Model of Sensible Heat Transfer
Figure 7. Temperature Gradient Across the Upper Turbulent Boundary Layer (dT/dy)
Figure 8. Sensible Heat Advection into the Floodplain (q'' from above)
Conclusions
References and Further Reading